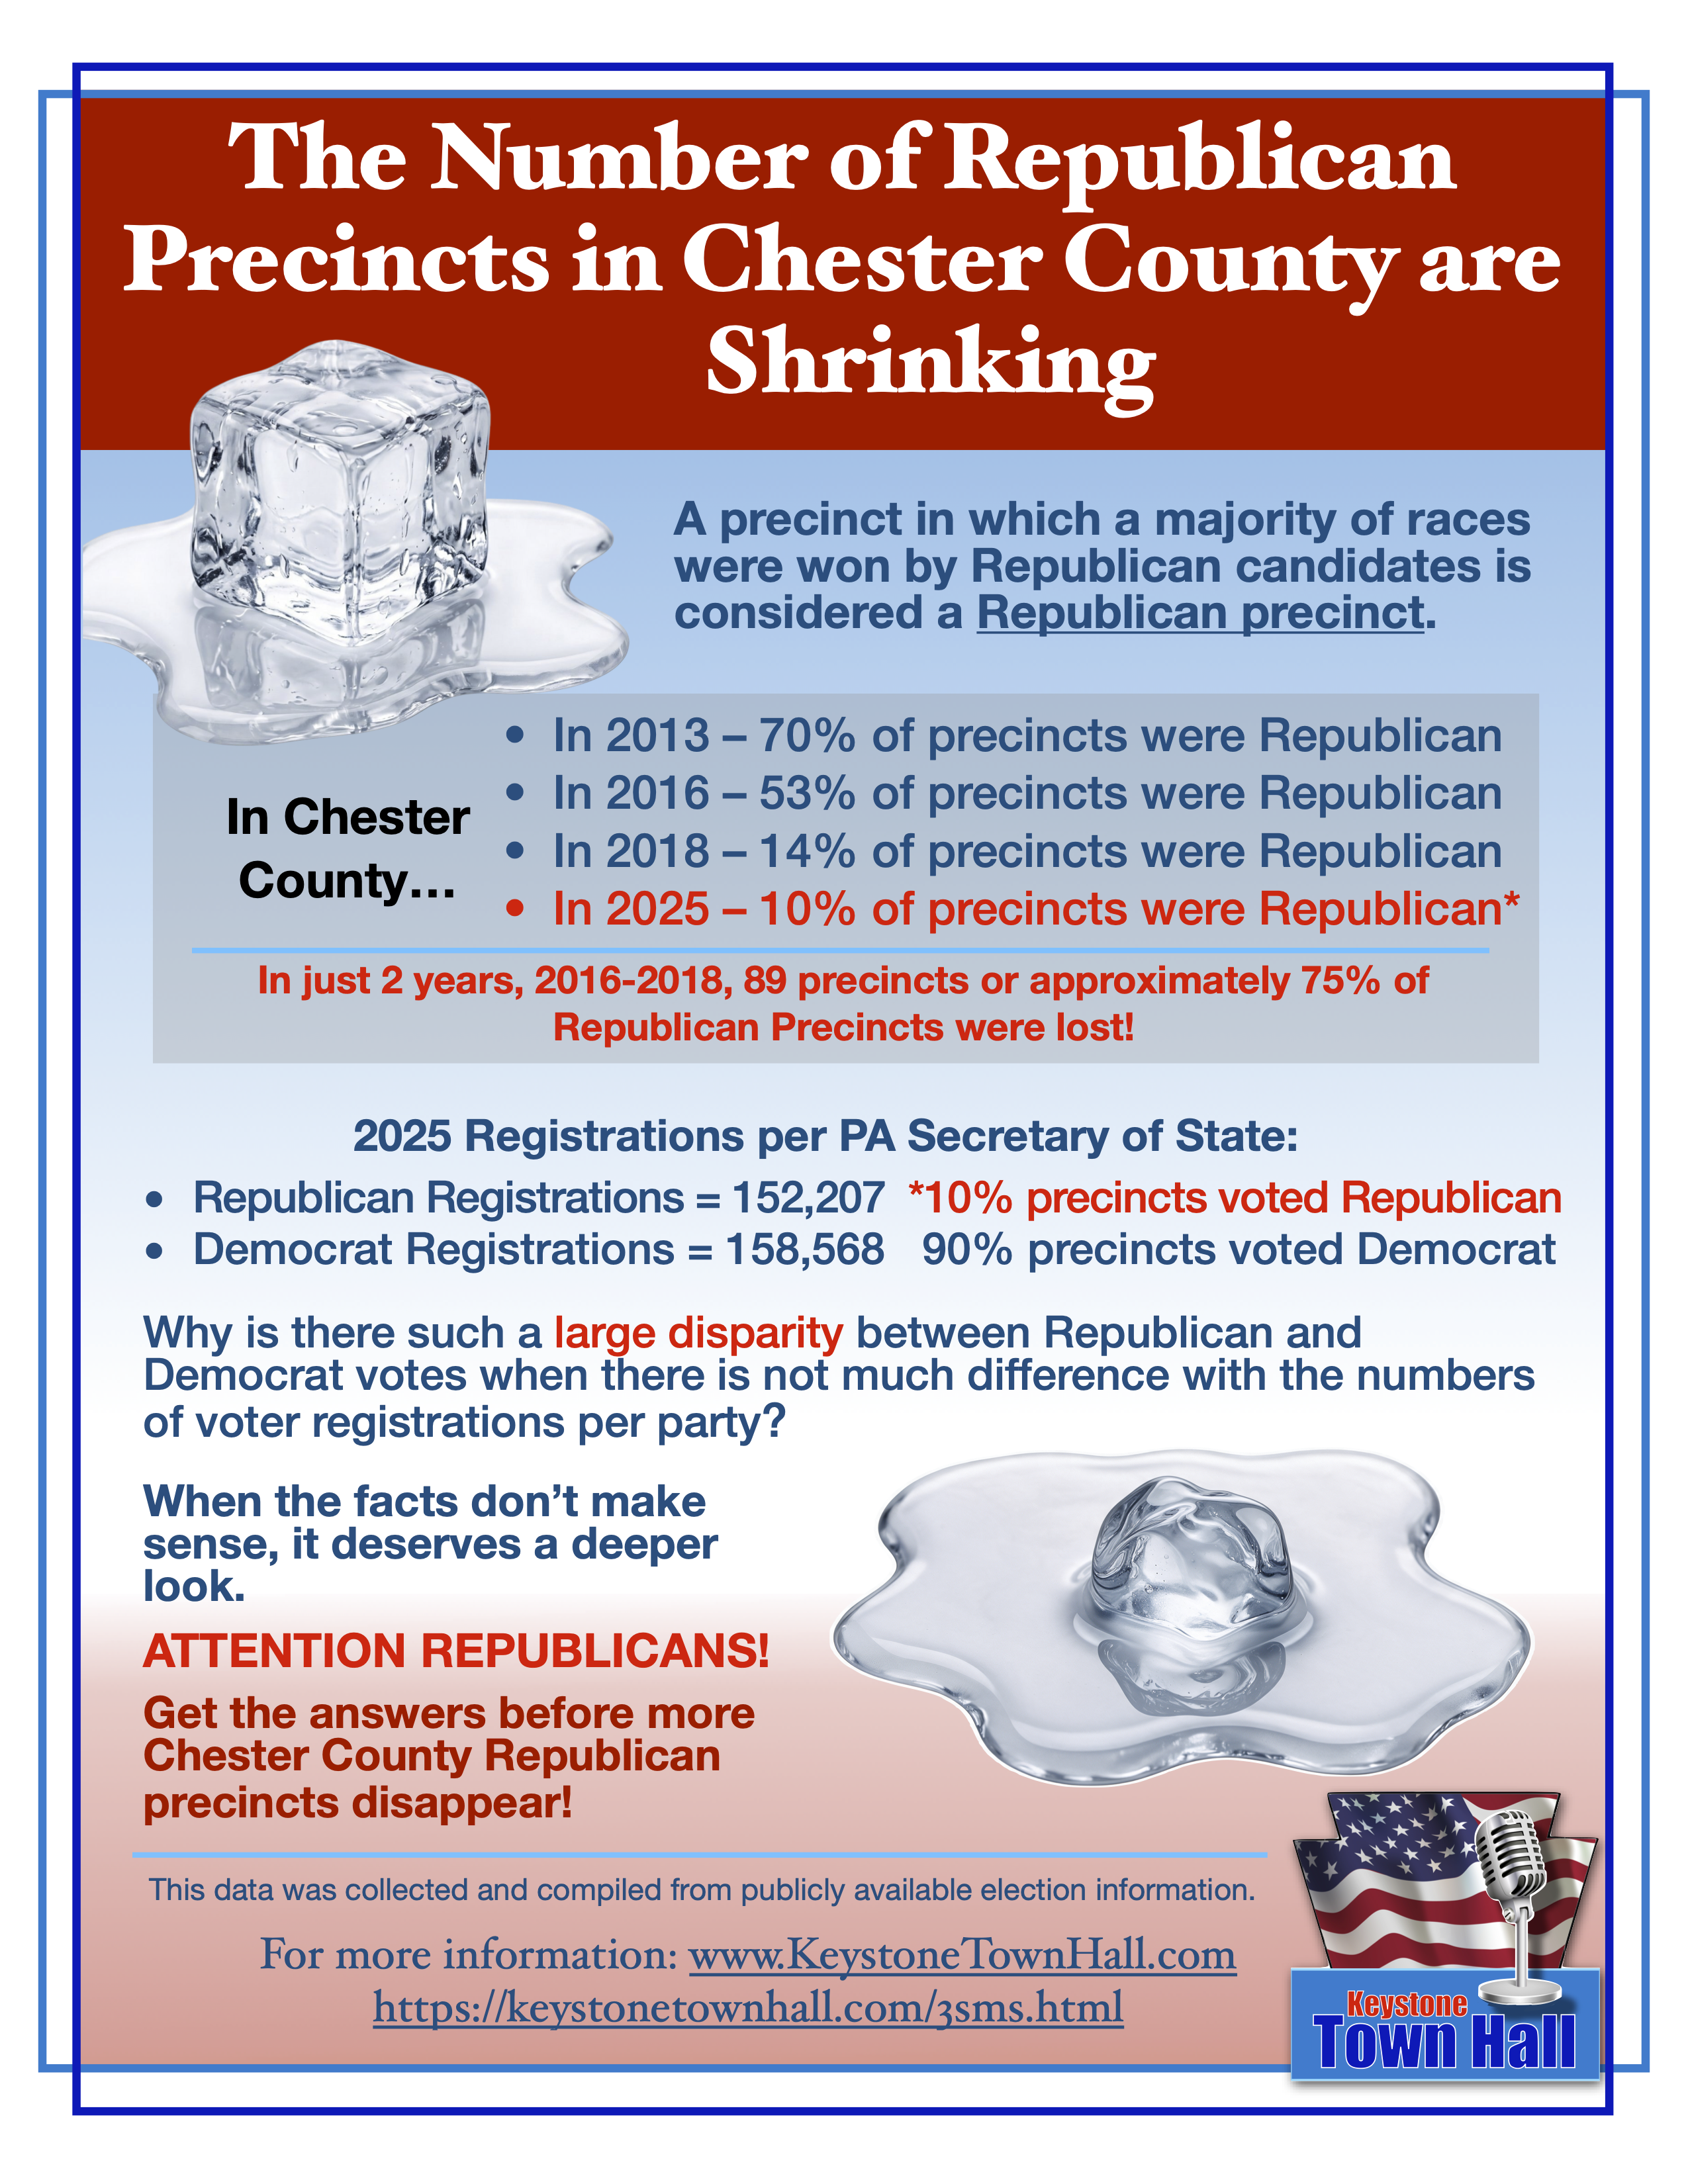
An analysis of election data going back for the past 30 years, reveals patterns within the data with unusual tendencies. The following illustrated data sets help to explain what is seen, but why these anomalies are occurring is still unknown.
To see the data that was used to create the illustrations, click on the link below each one.
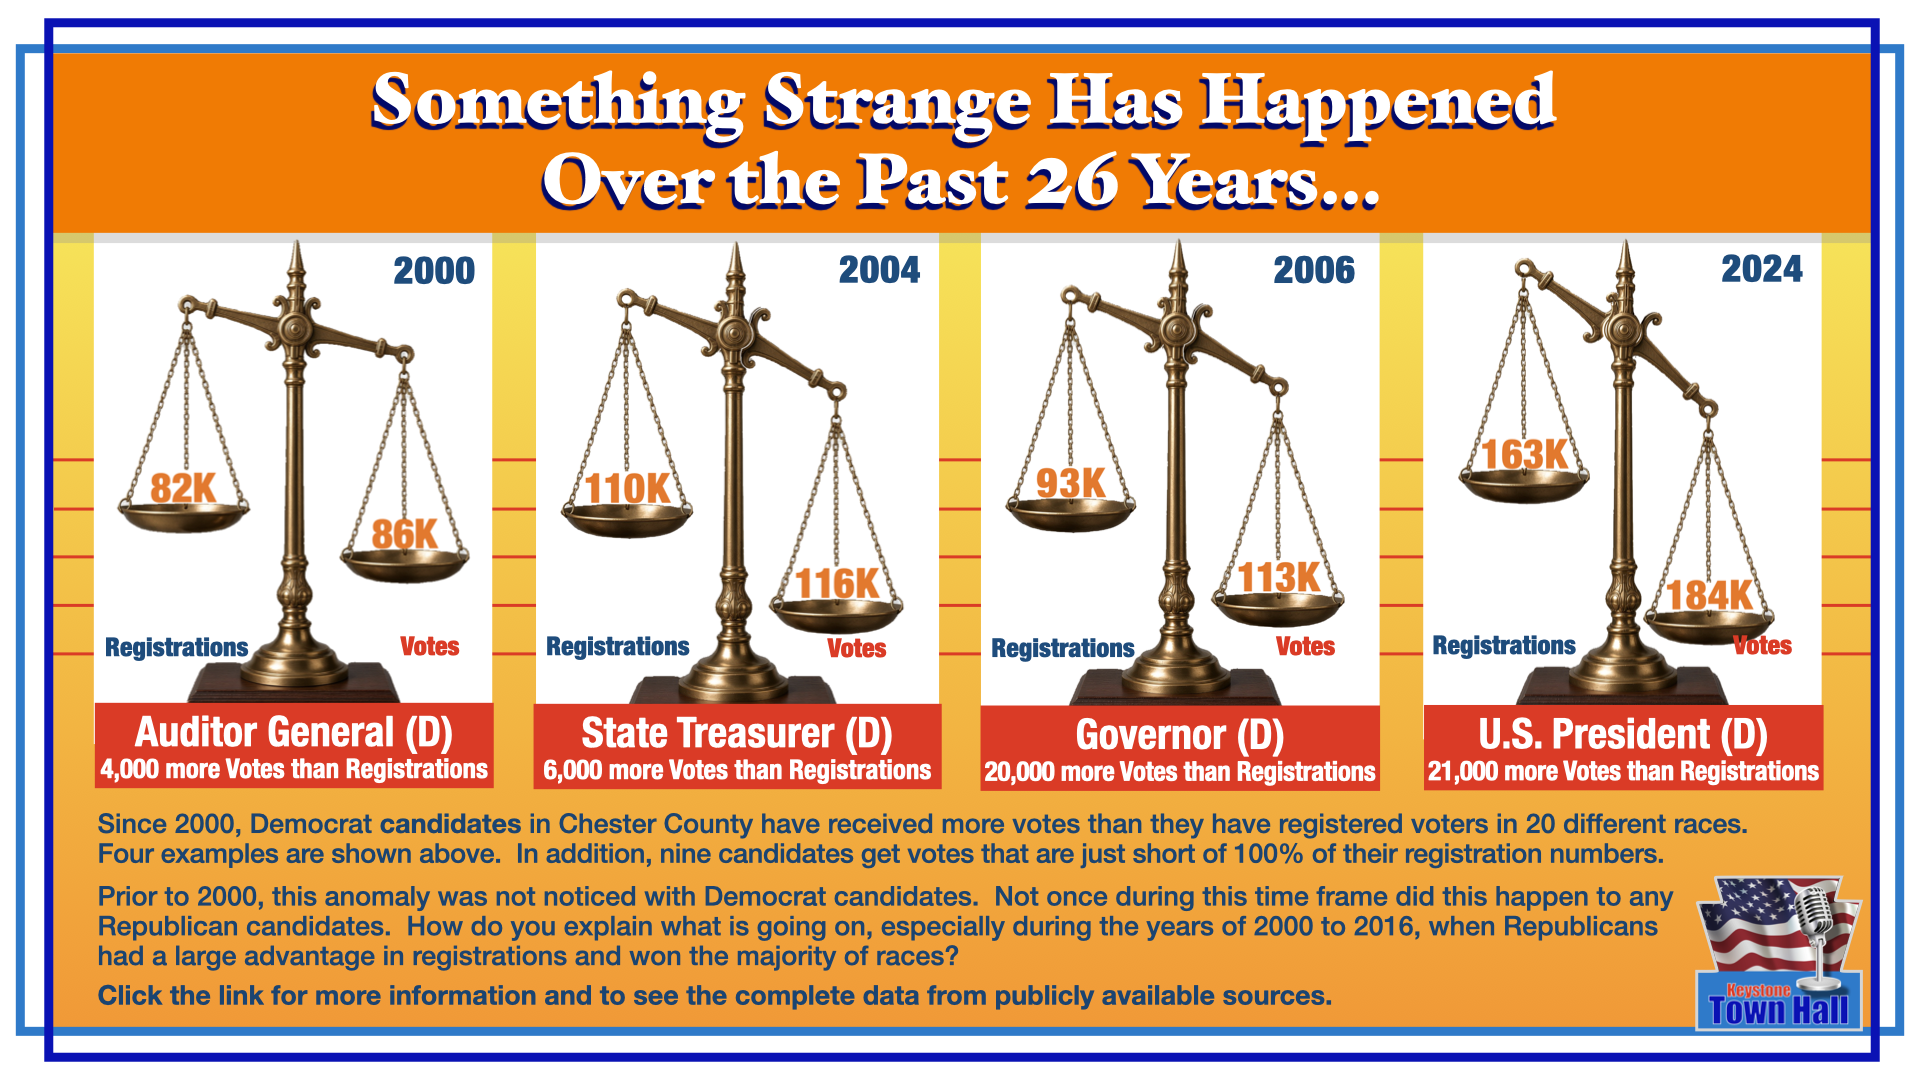
Chester County Democrat Candidates Get More Votes Than They Have Registrations
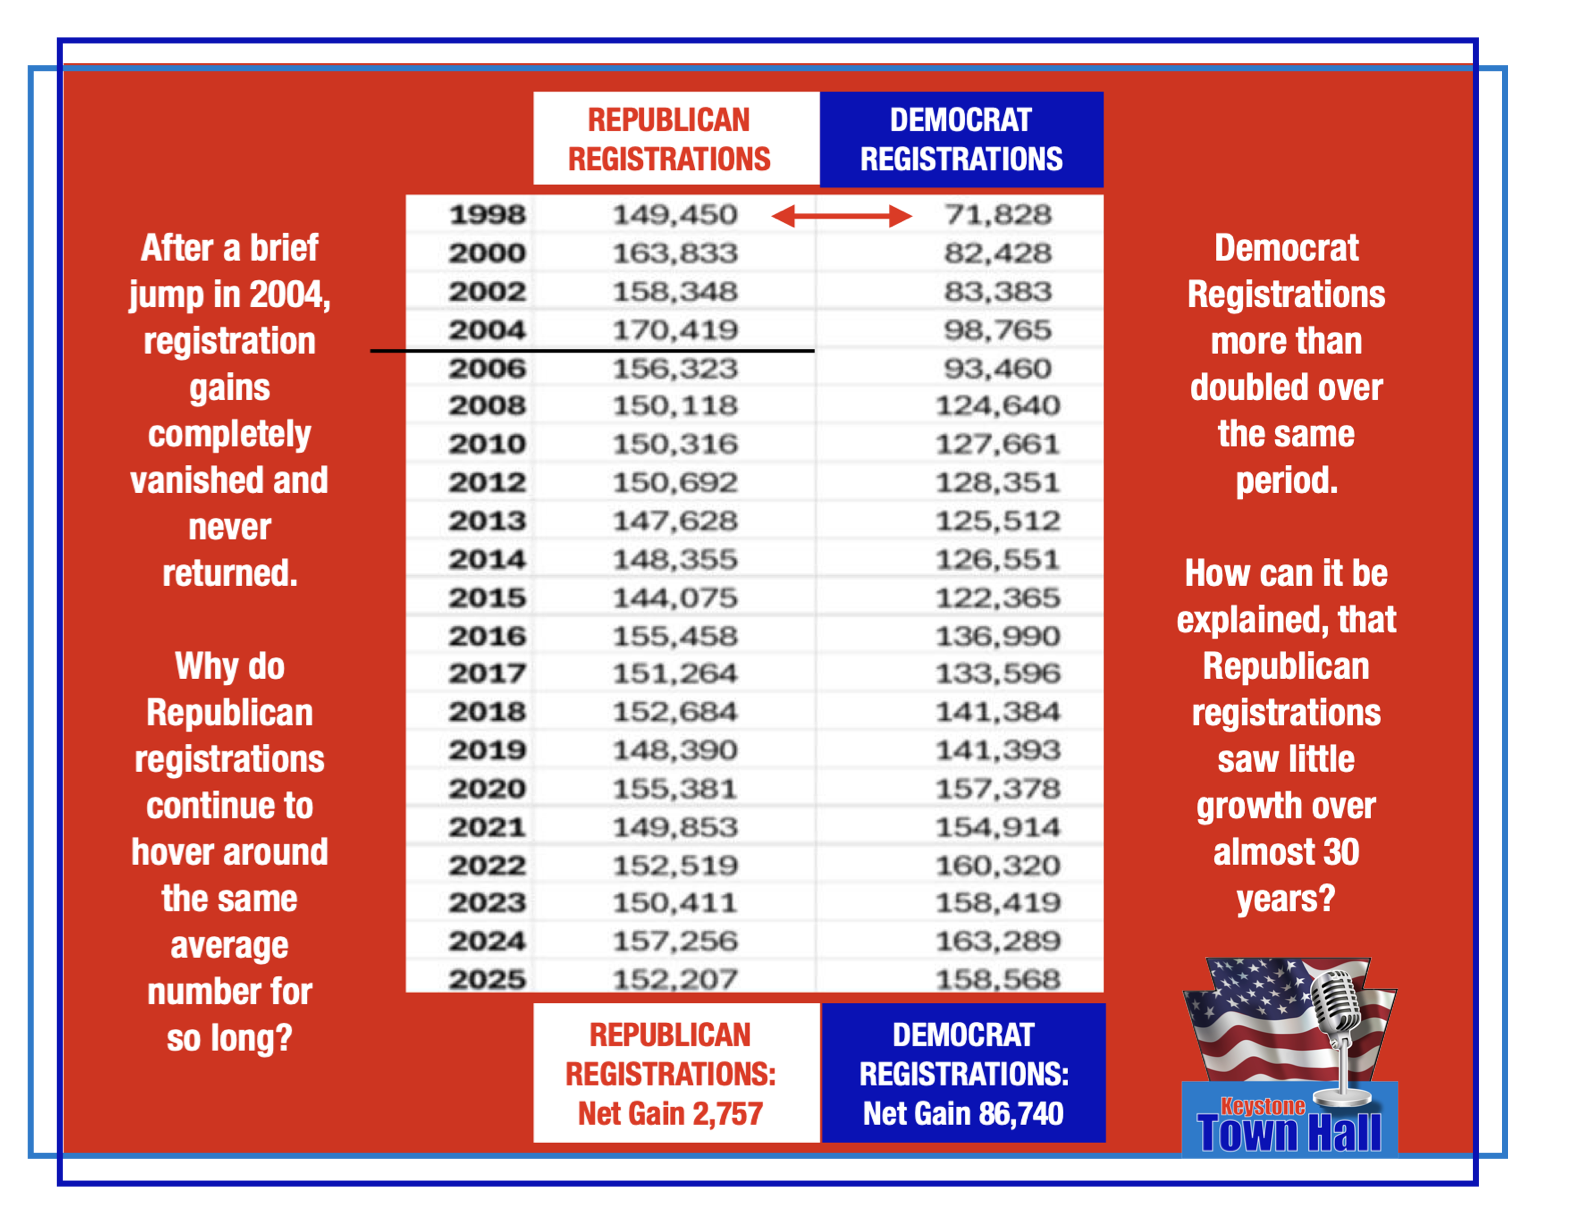
Average Number of Chester County Republican Voter Registrations Has Not Changed in 30 Years